非負値行列因子分解(NMF)とは、PCAと違って、第2成分以降が直交するベクトルではなく、すべてのベクトルが正の方向指す分析ベクトルとなる。 特徴量ごとにまとまりのあるデータに対しての特徴が掴みやすくなる。らしい。
元となる行列に近似する行列Yとなるような行列積XZのXの列数を、求める次元削減後の特徴量数となるよう計算する。 (Xの行数が元の行列の数、Zの列数が元の行列の列数となる)
import mglearn

mglearn.plots.plot_nmf_illustration()

左側の2componentsの場合、ベクトルが直行せずデータの特性に向けて方角が現れる。
例えば、顔画像の場合、顔が正面向きの成分、左向きの成分、右向きの成分や性別、歯が見えているかのベクトルなんかが現れてくる。はず。
顔画像の非負値行列因子分解
fetch_lfw_peopleは時間がかかるので注意。30分ほどは見ておこう。
また、人物によって顔画像枚数が異なる(多い人で200枚以上)ので、1人物あたり最大50枚を使用する。
import numpy as np
import matplotlib.pyplot as plt

from sklearn.datasets import fetch_lfw_people
from sklearn.model_selection import train_test_split
from sklearn.decomposition import NMF

people = fetch_lfw_people(min_faces_per_person=20, resize=0.7)
# reshapeする時の画像解像度に応じた行列
image_shape = people.images[0].shape

# 1人物50枚までにする為の処理。使用するindexにTrueを立てる、
# targetの数分のarrayを用意
mask = np.zeros(people.target.shape, dtype=np.bool)
for target in np.unique(people.target):
    # 各ターゲットの50件までTrueを立てる whereで条件に合うpeopleのindexを取得できる
    mask[np.where(people.target == target)[0][:50]] = 1

# Trueのデータのみ訓練、検証データに使用する
X_people = people.data[mask]
y_people = people.target[mask]

X_people = X_people / 255.

X_train, X_test, y_train, y_test = train_test_split(
    X_people, y_people, stratify=y_people, random_state=0
)

# NMF分解の実行 15個の特徴量に分解
nmf = NMF(n_components=15, random_state=0)
nmf.fit(X_train)
X_train_nmf = nmf.transform(X_train)
X_test_nmf = nmf.transform(X_test)

fix, axes = plt.subplots(3,5,figsize=(15,12), subplot_kw={"xticks":(), "yticks":()})
for i, (component, ax) in enumerate(zip(nmf.components_, axes.ravel())):
    ax.imshow(component.reshape(image_shape))
    ax.set_title("{}. component".format(i))
抽出した特徴量に対するプロット。

11はどことなく女性っぽいし、14なんかは左を向いているような感じに見えなくもない。
成分ごとの確認
分析した成分の特徴がよく出ている画像トップ5を確認します。
component 3の場合
compn = 3
# 3つ目の成分でソート、
inds = np.argsort(X_train_nmf[:, compn])[::-1]
fig, axes = plt.subplots(2,5,figsize=(15,8),subplot_kw={"xticks":(), "yticks":()})
for i, (ind, ax) in enumerate(zip(inds, axes.ravel())):
    ax.imshow(X_train[ind].reshape(image_shape))
メガネをかけた向かって右向きの画像が多い。

compn = 5:笑顔?おでこが出ている。

compn = 11:女性?

compn = 14:左向きが多い

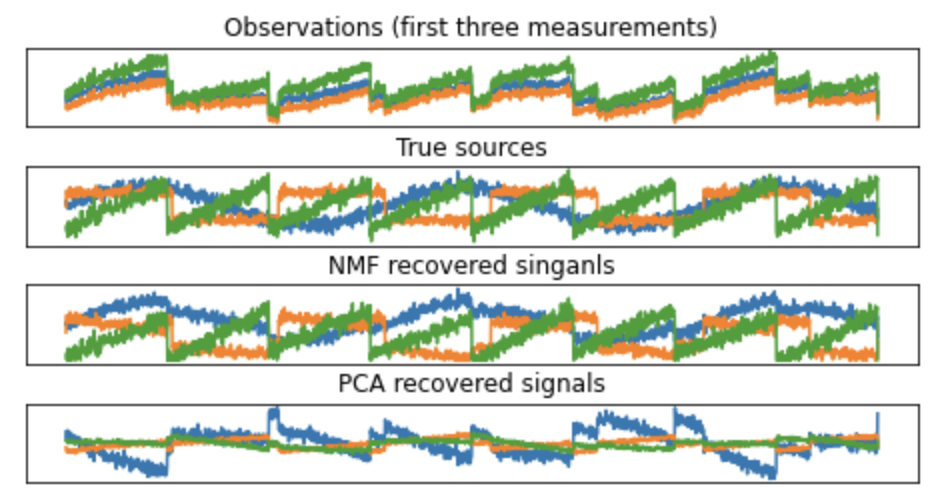
混ざった信号の発信源の分析
また冒頭に示したように行列積の積の元となったベクトルを計算するので、分解する成分数がわかっている場合、元のベクトルを再現しやすい。
3つの発信源(3次元)から変化した100次元のデータを分解
# 元となる発信源 3つの発信源
S = mglearn.datasets.make_signals()
print(S.shape)
plt.figure(figsize=(6,1))
plt.plot(S,"-")
plt.xlabel("Time")
plt.ylabel("Signal")

# データを混ぜ合わせて100次元の状態を作る
A = np.random.RandomState(0).uniform(size=(100,3))
X = np.dot(S, A.T)
nmf = NMF(n_components=3, random_state=42)
S_ = nmf.fit_transform(X)

# 比較の為、PCAでも次元削減
from sklearn.decomposition import PCA

pca = PCA(n_components=3)
H = pca.fit_transform(X)

models = [X, S, S_, H]
names = ["Observations (first three measurements)", "True sources", "NMF recovered singanls", "PCA recovered signals" ]

fig, axes = plt.subplots(4, figsize=(8,4), gridspec_kw={"hspace":.5}, subplot_kw={"xticks":(), "yticks":()})
for model, name, ax in zip (models, names, axes):
    ax.set_title(name)
    ax.plot(model[:,:3],"-")

のように元の発信源と近似した成分が確認できる。

