k-means クラスタリングとは
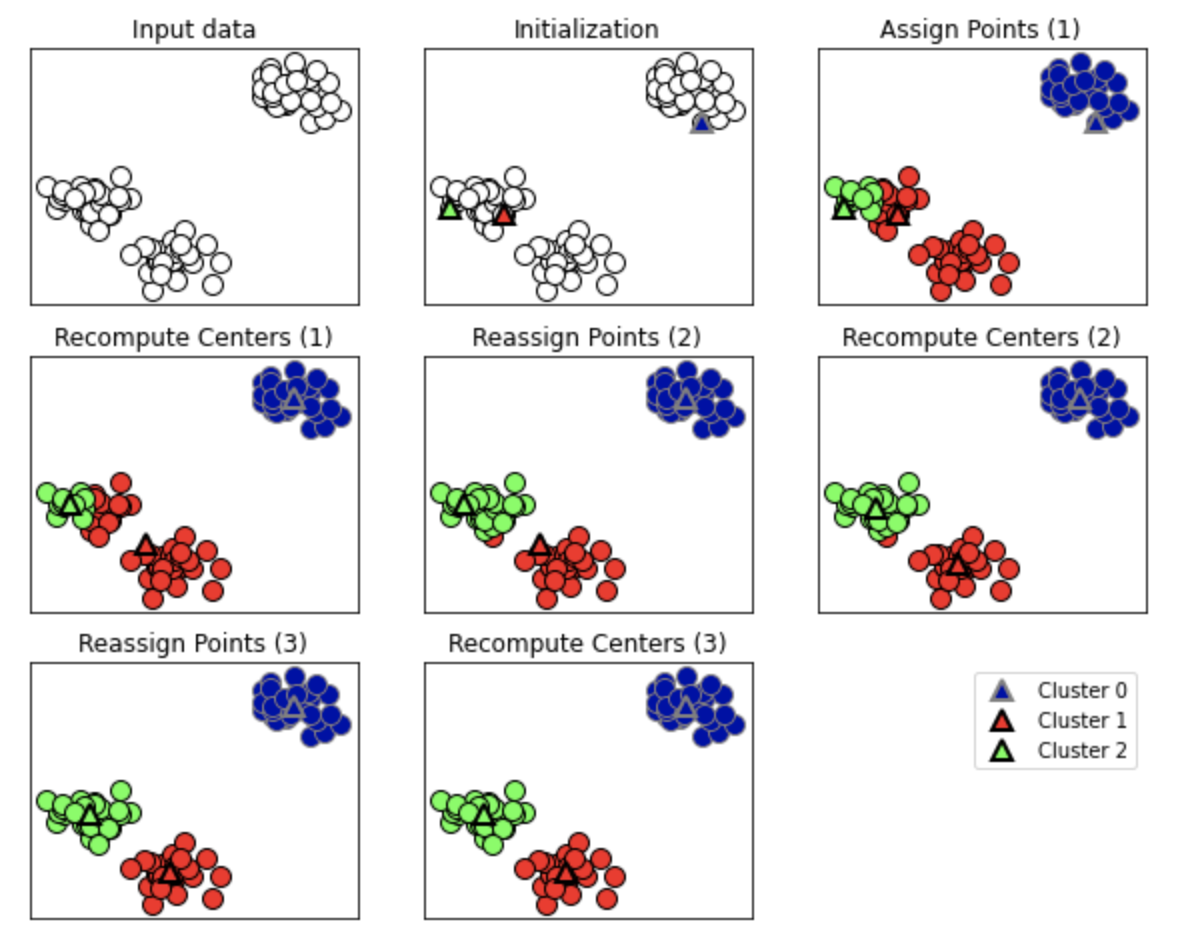
指定したクラスタの数の重心点を配置し、最も近いデータポイントに対して1次クラスタ分けを行う(Assign Point(1))
各クラスタごとの重心点をクラスタの重心に合うよう移動させていく(Recompute center(1))
重心点を移動させたことにより最も近いデータポイントも変更されるので再度クラスタ分けを行う(Reassign Point(2))
重心点の移動がされなくなるまで繰り返す
クラスタリング境界は重心点の中間をとる
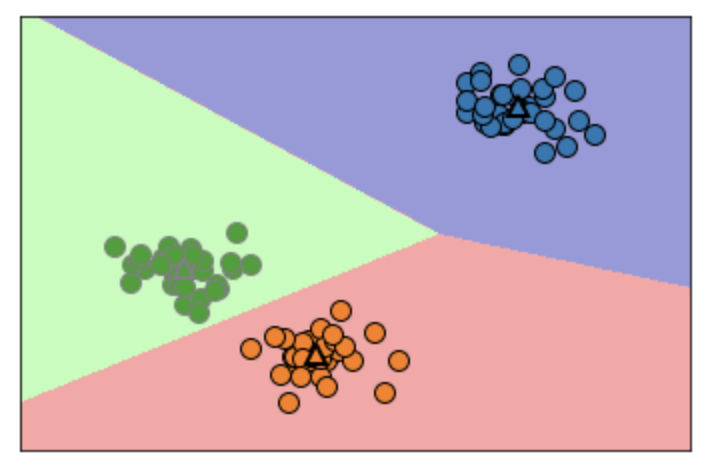
k-meansクラスタリングを使用する
import mglearn
import matplotlib.pyplot as plt
import numpy as np
from sklearn.model_selection import train_test_split
from sklearn.datasets import make_blobs
from sklearn.cluster import KMeans

X, y = make_blobs(random_state=1)

kmeans = KMeans(n_clusters=3)
kmeans.fit(X)

mglearn.discrete_scatter(X[:,0], X[:,1], kmeans.labels_, markers="o")
mglearn.discrete_scatter(
    kmeans.cluster_centers_[:, 0], kmeans.cluster_centers_[:, 1], [0, 1, 2], markers="^", markeredgewidth=2
)
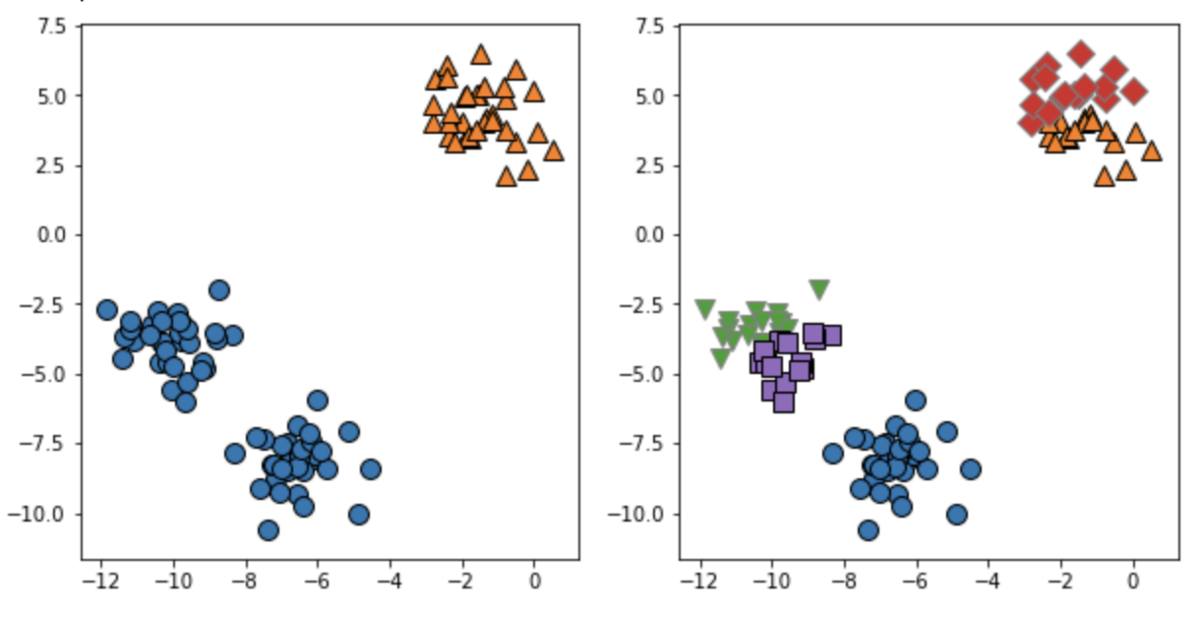
クラスタリング数を変更
クラスタリング数を2と5に変更すると以下のような境界になる。
k-meansがうまくいかないデータセット
中央クラスタのようにまとまりが広いと、重心点の近傍が他方のクラスタに吸われてしまう。
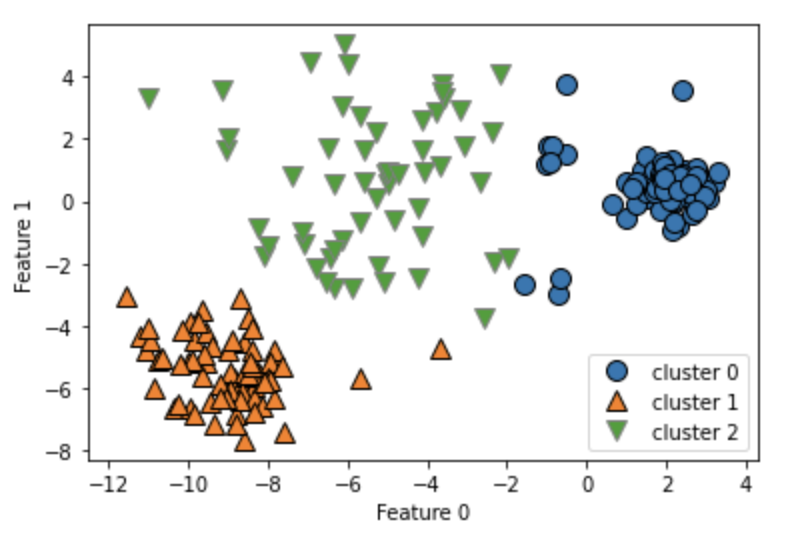
以下のような形状も、他方のクラスタに吸われてしまう。
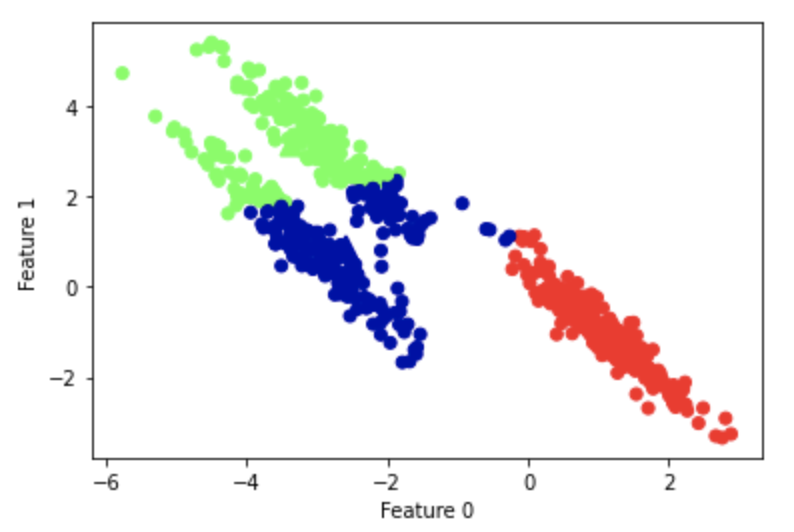
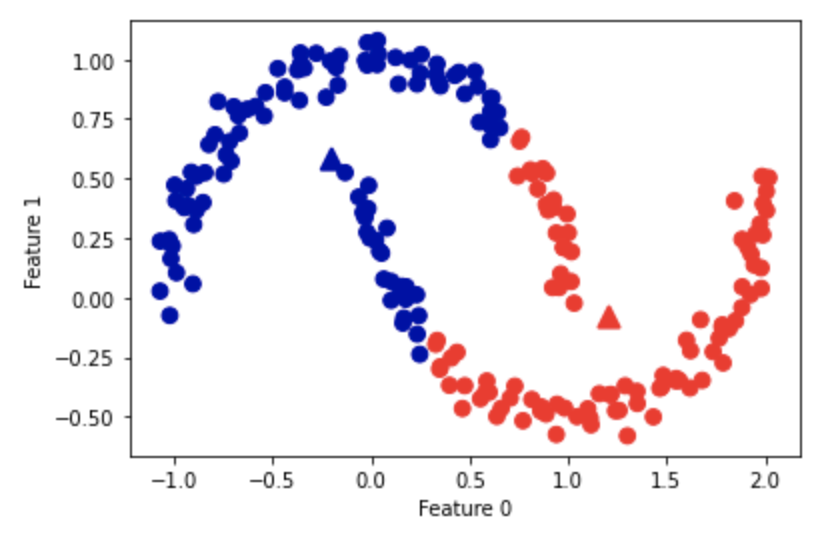
クラスタの幅が大きく、クラスタ間の境界が狭い時は分類しづらくなる。
k-meansの成分
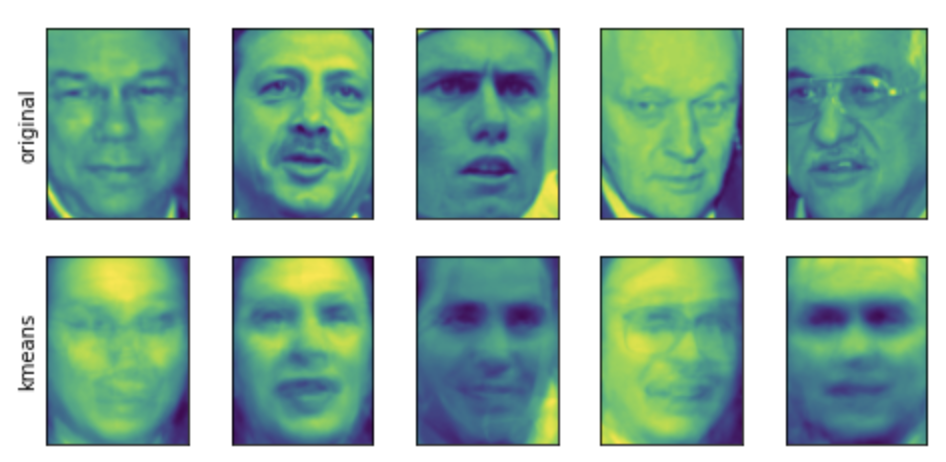
分類されたクラスタの成分は各重心点となるので、NMFのように可視化、成分から復元することができる。
from sklearn.datasets import fetch_lfw_people

people = fetch_lfw_people(min_faces_per_person=20, resize=0.7)
image_shape = people.images[0].shape

# targetの数分のarrayを用意
mask = np.zeros(people.target.shape, dtype=np.bool)
for target in np.unique(people.target):
    # 各ターゲットの50件までTrueを立てる whereで条件に合うpeopleのindexを取得できる
    mask[np.where(people.target == target)[0][:50]] = 1

# Trueのデータのみ訓練、検証データに使用する
X_people = people.data[mask]
y_people = people.target[mask]

X_train, X_test, y_train, y_test = train_test_split(
    X_people, y_people, stratify=y_people, random_state=0
)
kmeans = KMeans(n_clusters=100,random_state=0)
kmeans.fit(X_train)
X_reconstructed_nmf = np.dot(nmf.transform(X_test), nmf.components_)

fig, axes = plt.subplots(1, 5, figsize=(8, 8),
                        subplot_kw={"xticks":(), "yticks": ()})
for ax, comp_kmeans in zip(
    axes.T, kmeans.cluster_centers_ ):
    ax[0].imshow(comp_kmeans.reshape(image_shape))

fig, axes = plt.subplots(2, 5, subplot_kw={"xticks": (), "yticks": ()},
                        figsize=(8,8))
# 再構成
fig.suptitle("Reconstructions")
for ax, orig, rec_kmeans in zip(
    axes.T, X_test, X_reconstructed_kmeans ):
    ax[0].imshow(orig.reshape(image_shape))
    ax[1].imshow(rec_kmeans.reshape(image_shape))

axes[0, 0].set_ylabel("original")
axes[1, 0].set_ylabel("kmeans")
各クラスタごとの成分

再構成。originと比較
特徴量以上の成分を抽出
次元削減とは違い特徴量以上の重心点を配置(成分の抽出)をすることができる。
n_cluster=10
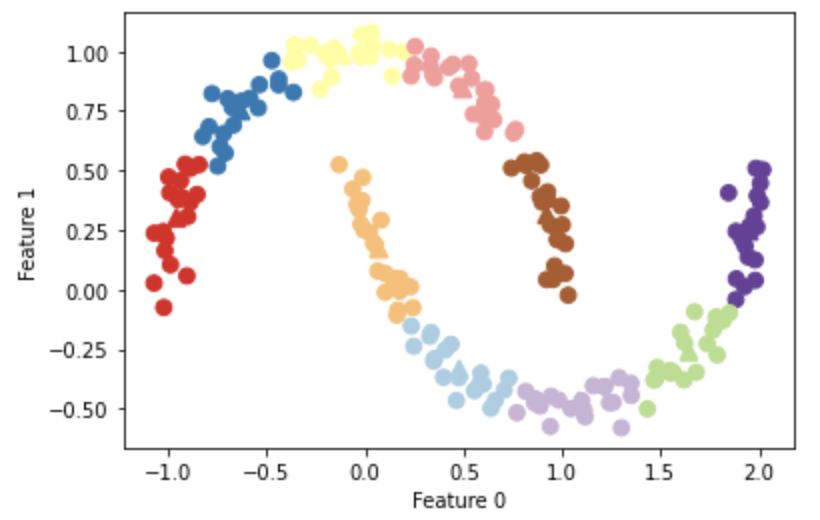
各データポイントと重心点までの距離を確認する。
distance_features = kmeans.transform(X)
print("Distance feature shape: {}".format(distance_features.shape))
print("Distance features: \n{}".format(distance_features))
1レコード(データポイント)につき各重心点までの距離が確認できる。
Distance feature shape: (200, 10)
Distance features:
[[0.9220768  1.46553151 1.13956805 ... 1.16559918 1.03852189 0.23340263]
 [1.14159679 2.51721597 0.1199124  ... 0.70700803 2.20414144 0.98271691]
 [0.78786246 0.77354687 1.74914157 ... 1.97061341 0.71561277 0.94399739]
 ...
 [0.44639122 1.10631579 1.48991975 ... 1.79125448 1.03195812 0.81205971]
 [1.38951924 0.79790385 1.98056306 ... 1.97788956 0.23892095 1.05774337]
 [1.14920754 2.4536383  0.04506731 ... 0.57163262 2.11331394 0.88166689]]
リンク

